
Home View
The Home View is Journalit's main workspace. It contains two modes: Overview for your personal widgets and shortcuts, and Dashboard for deeper performance analysis. Switch between them without opening a separate view.
Best use of Home View
Keep Overview focused on the information you check before trading and the actions you repeat every day. Use Dashboard mode for deeper analysis.
Home View Overview
Open Home View from the ribbon icon or the command palette with Ctrl+P, then
run Open Home View. Use the Overview / Dashboard
switch in the header to change modes. Each mode keeps its own layout, filters,
and scroll position. Many traders keep it alongside the navigation sidebar
so the workspace stays visible while the sidebar handles fast switching
between overview pages, reviews, and tools.

Quick Links row
A fast action bar for the views and commands you use constantly.
Widget grid
A drag-and-drop layout for performance, planning, and workflow widgets.
Personalised greeting
Shows your display name so the page feels like your workspace, not a generic dashboard.
The greeting shows a static welcome on the first Home visit. Later visits show an inline display name editor. Select the name, type directly in Home, confirm with Enter or blur, and cancel with Escape.
Quick Links

The Quick Links row is there to remove menu friction. Use it for the actions you reach for constantly.
Add Trade
Open the new trade form immediately.
Trade Log
Jump straight into the trade database.
Dashboard
Switch the shared Home workspace into performance analysis mode.
Accounts
See all trading accounts in one place.
Sync Trades
Synchronise every eligible Trade Sync provider in one action.
Settings
Open Journalit settings directly from Home.
Today's DRC
Open today's Daily Report Card.
This Week Review
Jump to the current weekly review.
This Month Review
Jump to the current monthly review.
Trade Import
Import trades from CSV, XLSX, or XLS.
Layout Builder
Edit review templates and workflow layouts.
Navigation Sidebar
Open Journalit's sidebar from a Quick Link that is hidden by default and can be restored when needed.
Customising Quick Links
Reorder links
Drag links into the order that matches your workflow.
Remove what you do not use
If a shortcut does not save you time, it should not stay in the row.
Put the critical actions first
The first few links should be the ones you use before, during, or immediately after a trading session.
Quick Links Position
You can place Quick Links at the top or bottom of Home View. Open the Home View settings gear, then use the arrow control to move the row.
Overview Filters

Use the filter button in the Overview header to choose the period, trade type, and accounts you want to see. Dashboard mode keeps a separate filter state, so changing one mode does not disturb the other.
Period
Choose the date range used by period-aware Overview widgets.
Trade type
Include regular, missed, or backtest trades where the widget supports those workflows.
Accounts
Scope trade-backed and account-backed widgets, including AUM and Drawdown Monitor, to the selected accounts.
Separate Dashboard filters
Dashboard mode keeps its own analysis filters and does not reuse the Overview selection.
How it behaves
Overview filters persist, so the workspace opens with the period, trade type, and account selections you left in place. Use Reset filters to restore All Time, Regular trades, and All Accounts together.
Background Image
Choose a background image from Settings → General → Home View Settings. Journalit copies the selected image into the vault and applies readable translucent surfaces to widgets, controls, and Quick Links.
Choose image
Select an image from your device and apply it to Overview mode.
Dashboard option
Use the same image in Dashboard mode when you want one visual workspace across both modes.
Clear
Remove the background and return to the normal Obsidian theme surfaces.
Available Widgets
The widget grid is where Home View becomes useful. Each widget either helps you make faster decisions, maintain process discipline, or review performance without extra clicks.
Shared analytics rules
Home analytics widgets follow the same analytics date basis and break-even threshold settings used across Dashboard and other Journalit views.
Do not add everything
More widgets do not automatically create a better workspace. Start with a few that support real decisions, then add more only when they earn the space.
Getting Started
The Getting Started widget is a checklist of core setup actions. Its Open the navigation sidebar item uses the same Open Sidebar action as Settings and marks itself complete whenever the sidebar is opened from any Journalit entry point.
Pinned accounts and setups
Home Quick Links can pin direct links to specific accounts and setups. Home and sidebar shortcut selections stay independent, so pinned Home items do not change the sidebar and sidebar shortcuts do not change Home.
Year Heatmap
What it shows
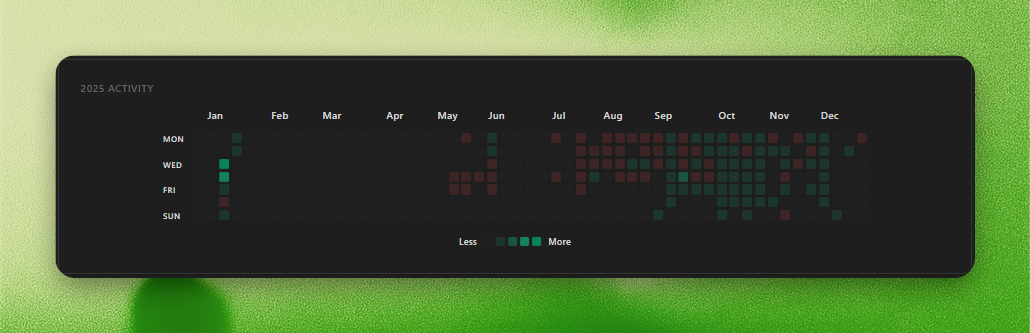
A GitHub-style heatmap of daily trading P&L, where each cell represents a day.
Why it matters
Patterns jump out quickly: good streaks, dead periods, overtrading bursts, and uneven consistency.
Useful interaction
Hover to inspect exact P&L. Click a day to open that day's Daily Report Card.
Adaptive sizing
Shows a year, six months, or three months depending on widget size so the cells stay readable.
Weekly Summary
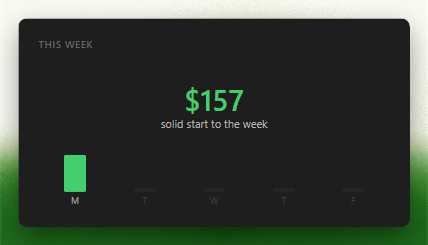
Week P&L
See the current week with daily context instead of waiting for a review note.
Trade count
Quick check on activity level and pacing.
Win rate
Useful as context, but not enough on its own to judge performance.
Daily sparkline
Tiny trend view for the current week, including neutral break-even day styling.
Break-even days use a neutral striped bar, while days without trades use a small muted dash. The weekly headline also follows the break-even threshold configured in Trades settings instead of treating every non-negative result as a winning week.
Key Events
Key Events brings the current Weekly Review schedule into Home, grouped by day with all-week events first. Use it to keep planned market events visible while you work without copying them into another note.

Weekly source of truth
The widget reads events from the current Weekly Review, so the schedule stays connected to the review workflow.
Compact day groups
See event labels, times, notes, and semantic colour markers in a scrollable Home widget.
Open the review
Select the widget, including its empty state, to open the current Weekly Review and edit the events there.
Position Size Calculator
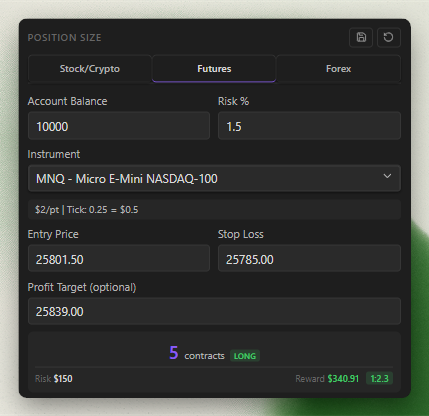
A built-in sizing tool on the home screen makes it easier to stay disciplined before you enter.
You can also open the calculator from Obsidian's command palette. Search for
Journalit: Open position size calculator, or assign your own shortcut
from Settings → Hotkeys.
Account size
Use the total account value or the portion of capital relevant to that setup.
Risk percentage
Define what you are actually willing to lose, for example 1%.
Entry and stop
Set the planned entry and stop loss so the size is derived from the setup, not a guess.
Output
See position size, dollar risk, and risk-reward context with the correct contract assumptions.
Goals
P&L goals
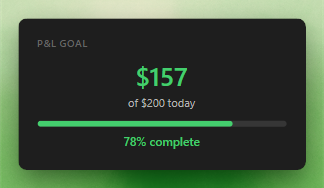
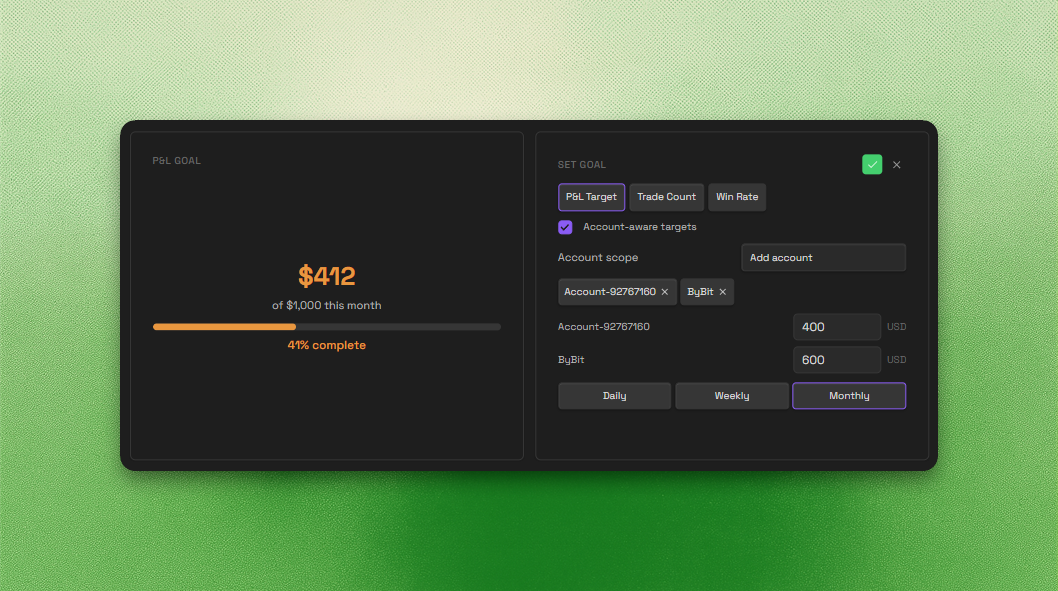
Track daily, weekly, or monthly targets, with optional account-specific targets when different accounts have different rules.
Trade count goals
Measure consistency milestones across all accounts or selected accounts.
Win rate goals
Pair execution quality with broader review, scoped to the account set that matters for the goal.
Account-aware progress
Home compares filtered performance against the matching configured account targets, so the numerator and target use the same account scope.
Copy-account inclusion
When copy-account analytics are enabled, a goal configured for a base account can include derived copied performance from accounts copying that base.
Click the widget to configure goals and monitor progress with clear visual indicators.
If the Home account filter is focused on an account without a configured target, the widget shows that scoped empty state instead of treating the target as zero.
Profit Target
The Profit Target widget shows account-level profit-target progress for accounts that have targets configured. Use it when prop-firm rules, account plans, or personal milestones are defined per account rather than as a general Home goal. Prop challenge accounts read their target from the current phase's rules.
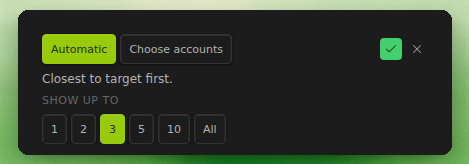
Open the widget settings from the header chevron, or by clicking outside an account row. Automatic shows the accounts closest to their target first, up to 1, 2, 3, 5, 10, or All (3 by default). Choose accounts lets you pick any set of accounts, with All and None shortcuts.
Account progress list
See configured accounts sorted by progress toward their profit target.
Remaining amount
Check how much profit remains before the account reaches its target.
Account handoff
Open the relevant account page directly from the widget when you need the account-level detail.
Streaks
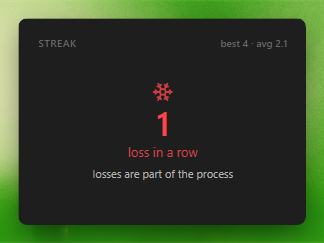
Current Streak widgets track consistency across several review habits. Add more than one instance when you want separate cards for trading outcomes and review completion.
Trade outcomes
Track the current winning or losing trade streak using closed positions.
Trade reviews
Count consecutive closed trades that were reviewed, while open and partially closed positions stay outside the streak.
Scheduled reviews
Track completed Daily Report Cards, weekly reviews, or monthly reviews against their calendar schedule.
Independent configuration
Choose one streak type per widget instance and save each card separately.
Current review periods remain pending until their period finishes. DRC streaks also follow your weekend setting. Home date and account filters do not change review streak calculations.
Use streaks to support a repeatable process, not to justify a trade or rush a review just to preserve the count.
Unreviewed Trades
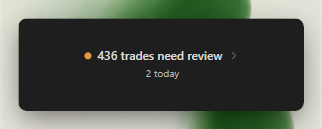
Shows trades that have not been marked as reviewed yet. Click through to the Trade Log with unreviewed trades selected and work them down instead of letting post-trade analysis pile up. Existing Trade Log filters are preserved unless they conflict with the unreviewed-trades shortcut.
Recent Items
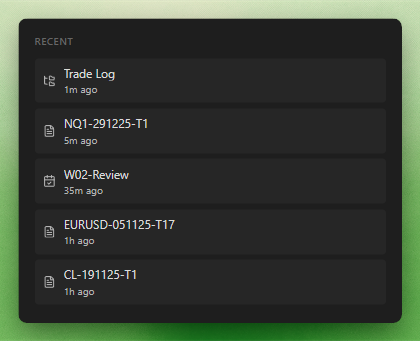
Recent Items is pure workflow speed. It gives you a quick jump back to the notes, views, or dashboards you were already working on.
Setup Leaderboard and Top Breakdown
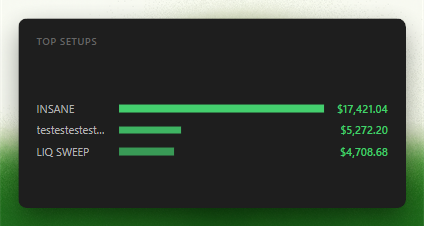
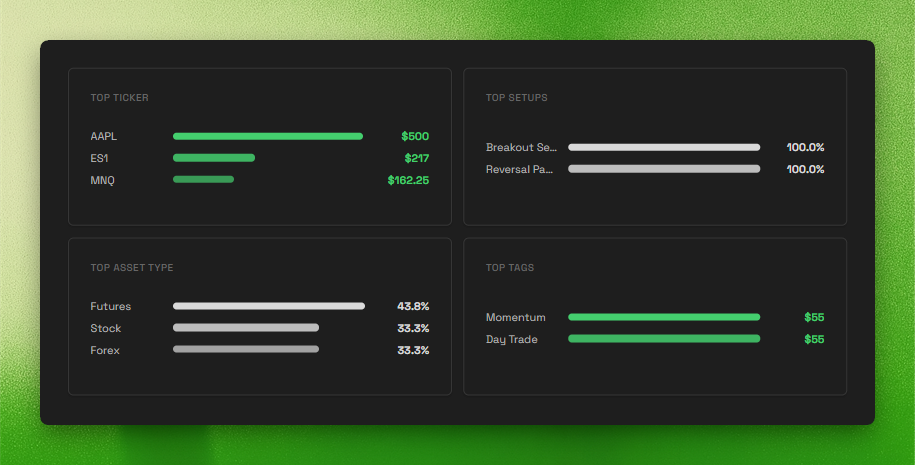
This widget ranks setups and strategies by performance. It can also switch into Top Breakdown mode for grouped analysis.
Setup view
Rank trading setups directly so your strongest and weakest patterns are obvious.
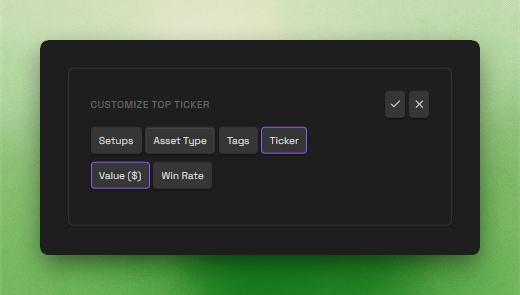
Top Breakdown mode
Group by setups, asset types, tags, or tickers depending on what you want to analyse.
Why it matters
Good for spotting whether your edge lives in a specific market, label, or execution style.
Best Hours
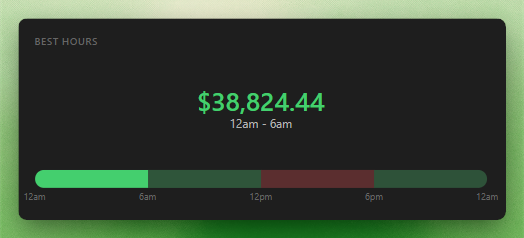
Best Hours highlights the time-of-day patterns hidden in your trade history. If you are consistently strong in one session and weak in another, this widget makes it hard to ignore.
30-minute entry windows
The widget groups trades by entry time, so comparisons like 09:30 to 10:00 versus 10:30 to 11:00 stay practical.
Sample-aware ranking
A time window needs enough trades across enough trading days before Journalit treats it as a reliable candidate.
Average P&L context
The headline focuses on the strongest eligible time window, with average P&L shown as supporting context.
Privacy mode
Privacy mode hides outcome-derived best-time information and keeps the timeline visually neutral.
Trading Score
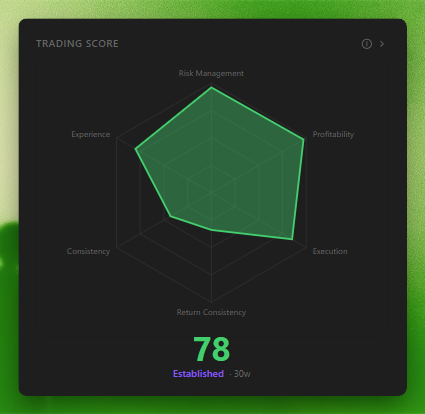
Trading Score is Journalit's composite performance rating shown as a radar chart. It is designed to summarise trading quality, not just raw return.
When the Home account filter is active, the radar chart compares selected accounts against the All baseline. A single selected account shows one account overlay; multiple selected accounts show each selected account with a compact legend and tooltip breakdown.
Risk Management (25%)
Looks at drawdown control and recovery factor. This is about protecting capital first.
Profitability (20%)
Uses profit factor and expectancy to measure whether the strategy actually has edge.
Execution (15%)
Uses win rate and win/loss ratio, with support for trend-following styles that win less often but pay larger.
Consistency (15%)
Rewards steadier return patterns over chaotic swings.
Experience (15%)
More active weeks and more consistent data produce more trustworthy scores.
Return Consistency (10%)
Checks whether your wins and losses are roughly controlled rather than random in size.
AUM Widget
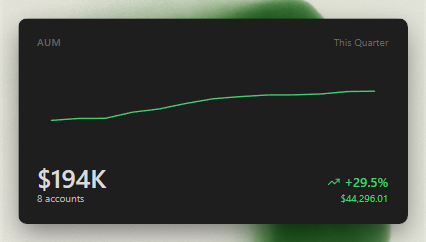
Shows total Assets Under Management across your accounts with trend context. Click the widget to open Accounts.
Drawdown Monitor
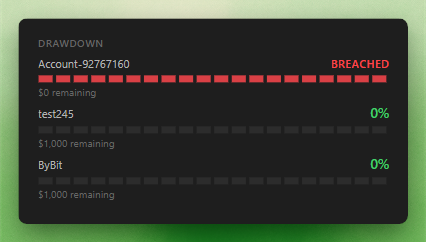
Useful for prop firm traders or anyone operating under strict loss limits. It keeps drawdown status visible without needing to dig through account screens. Prop challenge accounts use the drawdown rule of their current phase. The widget has the same settings page as Profit Target, with Automatic and Choose accounts modes.
Eval ROI
Evaluation spend against payouts across your prop challenge accounts, with the net of the two. It answers whether the attempts have paid for themselves, which is the question a list of individual challenges never quite answers.
Spent, Payouts, Net
Total evaluation fees and other one-time costs, total payouts taken, and what is left after the two are set against each other.
Break-even
Shown in place of a return figure when spend and payouts cancel out, rather than reporting a misleading zero percent.

Challenge Alerts
One row per prop challenge account that needs a decision, worst first. Selecting a row opens that account page.
Ranked by severity
A failed phase comes first, then a new account, then a passed phase or a target reached, then a payout ready, then a payout no longer available.
One row per account
An account with several notices shows only its most severe one, so the widget stays a decision list rather than a feed.
Both widgets need prop challenges
Neither widget appears on Home by default, and both report an empty state until at least one account is tracked as a prop challenge. See Prop Challenges.
Embedded Note
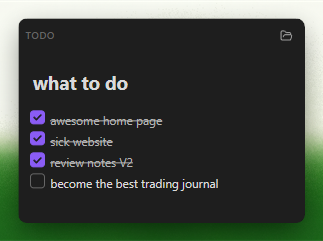
Display any markdown note directly on Home View. Checkboxes remain interactive, so you can treat it as a live workflow panel instead of a static note preview.
Daily rules
Keep trading rules visible before you place anything.
Pre-market checklist
Use it for repeatable prep tasks you want in front of you every session.
Market thesis
Pin the current narrative, levels, or scenarios to the dashboard.
Weekly focus areas
Keep process adjustments visible while you work.
Configure the source note in the widget settings.
Customising the Layout
Adding Widgets
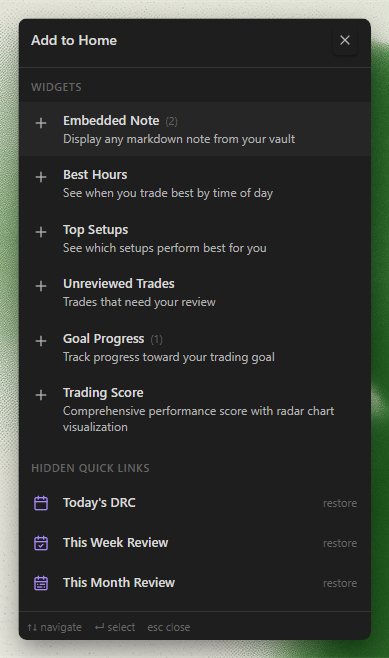
Click Add Widget to open the widget drawer on the right. Every widget has a miniature preview. Browse by category tab or search by name, description, category, or type. Widgets already in the layout are listed under In use.
Arranging Widgets
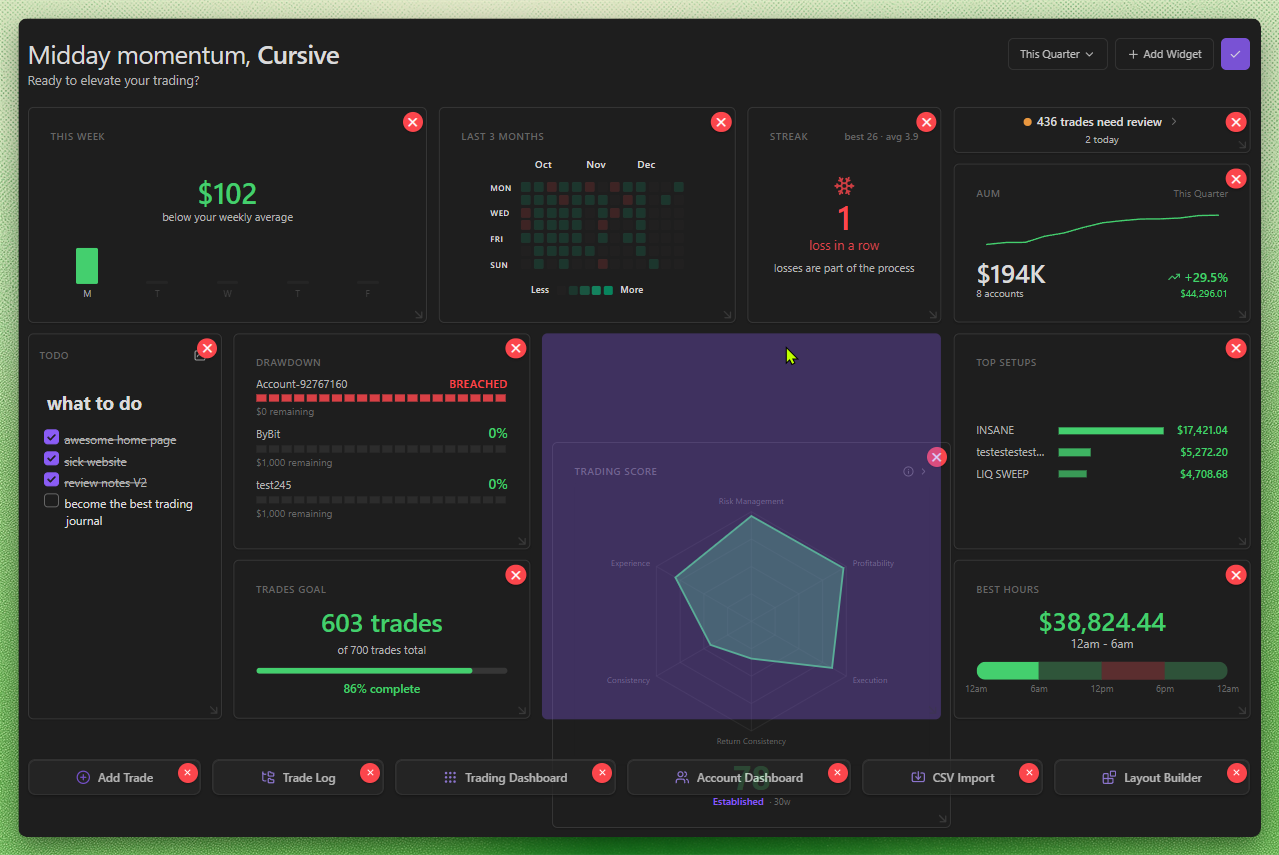
Move widgets
Drag a widget into a new position.
Resize widgets
Drag widget corners or edges to give more space to the views that need it.
Remove what is not useful
Use the remove control to keep the layout lean.
Your layout saves automatically, so Home View can evolve with your workflow.
Practical starting layout
Start with Year Heatmap, Weekly Summary, and Position Size Calculator. Add the rest only when they support actual decisions. A cluttered home screen defeats the point.
Built-in guide
Home includes its own contextual guide. To replay it later, open the command
palette and run Replay guide for current view while Home is active.
You can also make Home View open automatically when Obsidian launches:
Settings → General → Home View Settings → Home View Auto-Open, then set it to Always open + focus.