Trading Dashboard
Most trading dashboards are either noise-heavy or too shallow to be useful. Journalit's Trading Dashboard is designed to sit in the middle: enough detail to spot patterns, enough flexibility to match your workflow, and enough structure to keep you focused on what actually matters.
What the dashboard is for
Use it to understand behaviour and performance. Do not turn it into a screen that encourages emotional reactions to every short-term swing.
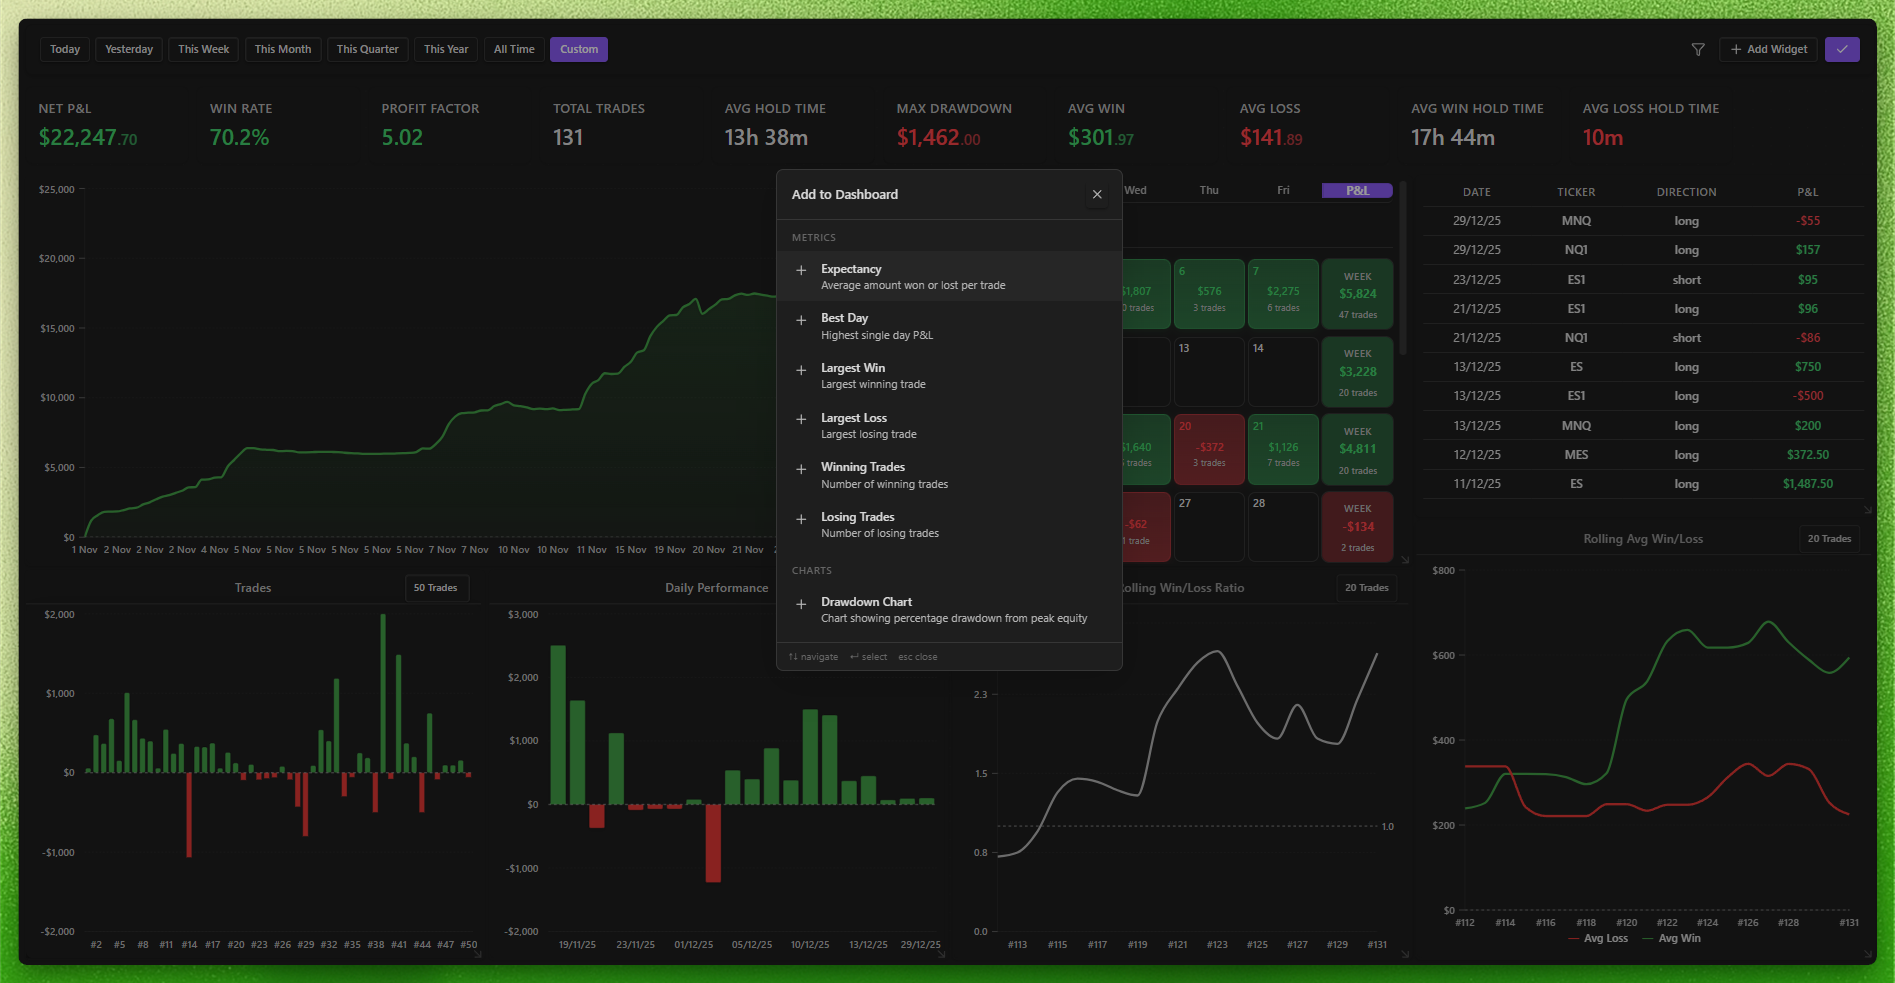
Dashboard Overview

Performance metrics at the top
Your headline numbers such as Net P&L, Win Rate, Profit Factor, and other key statistics.
Visual widgets below
Charts, calendars, and tables that reveal patterns in performance and execution.
Fully customisable layout
Reorder metrics, resize widgets, and remove anything that does not help.
Previous-period context
Headline metrics include comparison rows where a prior period gives useful context for the selected range.
Performance Metrics
The top metric strip gives you the fastest read on whether your trading is healthy, breaking down, or simply noisy.
For common ranges such as week, month, quarter, year, and custom periods, metric cards can show a compact comparison against the matching previous period. Current in-progress ranges compare against the equivalent elapsed portion of the prior period, so a mid-month dashboard is not judged against a full prior month.
Core Metrics
Net P&L
Your bottom line. If this is wrong, the rest of the dashboard becomes explanation rather than celebration.
Win Rate
Profitable trade percentage. Useful, but dangerous if you read it without context.
Profit Factor
Total profits divided by total losses. Above 1.0 means profitable. Above 2.0 is strong.
Expectancy
Average expected gain or loss per trade. One of the clearest measures of actual edge.
Max Drawdown
Largest peak-to-trough decline. Critical for position sizing and emotional realism.
Best Day
Your strongest single trading day in the filtered set, grouped by the active analytics date basis.
Best Streak
Longest consecutive winning streak in the filtered data, based on the active analytics date basis.
Worst Streak
Longest consecutive losing streak in the filtered data, based on the active analytics date basis.
MAE/MFE metrics
Optional heat and excursion metrics such as Avg Winner Heat, Winner MAE P90, Winner Avg MFE, and Loser MFE P90.
Largest Win
Your single biggest winner, with inline return-percentage context when Journalit can calculate it authoritatively.
Largest Loss
Your single biggest loser, with inline return-percentage context when Journalit can calculate it authoritatively.
Payoff and Avg RR
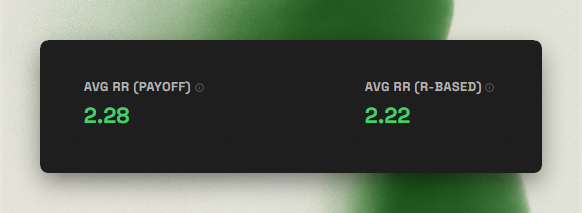
Payoff
Tracks how much the average winner makes relative to the average loser.
R-based Avg RR
Shows whether realised outcomes line up with the risk-reward you intended to take.
Volume Metrics
Total Trades
How many trades exist in the filtered period.
Winning Trades
Count of profitable trades.
Losing Trades
Count of unprofitable trades.
Avg Win
Average size of winning trades, with inline return-percentage context when Journalit can calculate it authoritatively.
Avg Loss
Average size of losing trades, with inline return-percentage context when Journalit can calculate it authoritatively.
Timing Metrics
Avg Hold Time
Average duration positions stay open.
Avg Win Hold Time
How long you usually hold winning trades.
Avg Loss Hold Time
How long you usually hold losing trades.
Why timing matters
Hold-time comparisons make it obvious when you are cutting winners early or letting losers sit too long.
Dashboard Widgets
Widgets are the analytical layer of the dashboard. Add the ones that help you see what your metrics alone cannot.
Cumulative P&L Chart
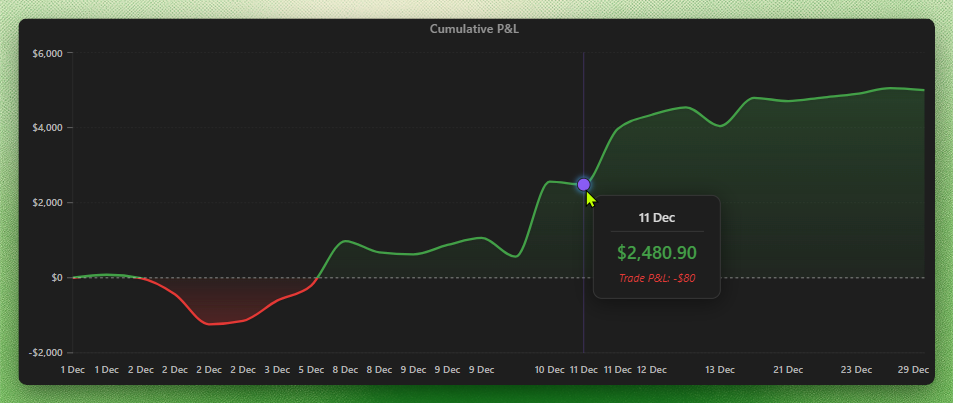
This is your equity curve. It is the most honest high-level picture of whether your trading process is compounding well or leaking over time.
Performance Calendar

Monthly view
See daily P&L in a compact calendar rather than a spreadsheet of dates.
Colour-coded days
Green for profitable days, red for losses, neutral styling for break-even sessions.
Review navigation
Open DRCs from day cells, or jump to weekly, monthly, quarterly, and yearly reviews from the calendar header and weekly totals.
Sidebar calendar
Use the calendar sidebar when you want the same date-based review navigation beside other Obsidian panes.
Pattern discovery
Useful for finding day-of-week habits, overtrading pockets, or session-level bias.
Daily Performance Chart
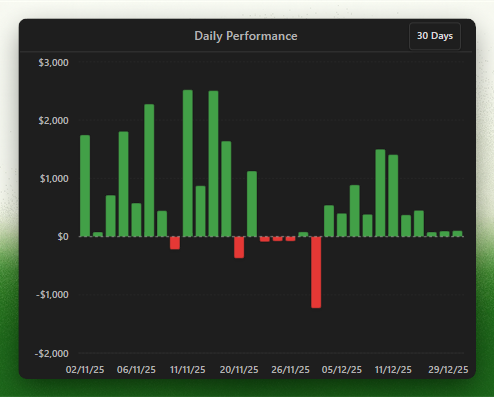
A bar chart of P&L by trading day. Good for seeing streaks, choppiness, and whether your results come in clusters or steady flows.
Weekday Performance Widget
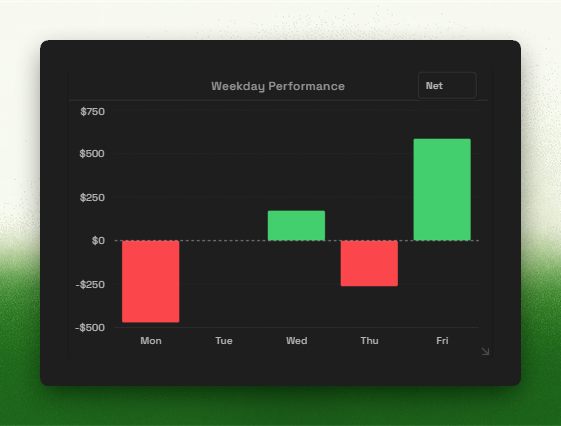
Day-of-week breakdown
Compare performance by weekday to see where your execution is strongest.
Persistent metric toggle
Keep the widget on Net P&L, expectancy, win rate, or your preferred metric.
Individual Trades Chart
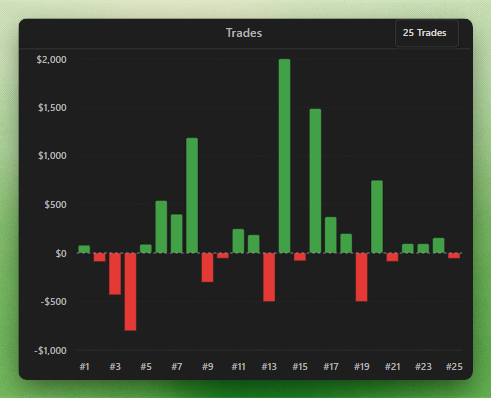
Every trade appears as a bar above or below zero, which makes trade distribution and outcome asymmetry much easier to see than reading rows in a table.
Drawdown Chart
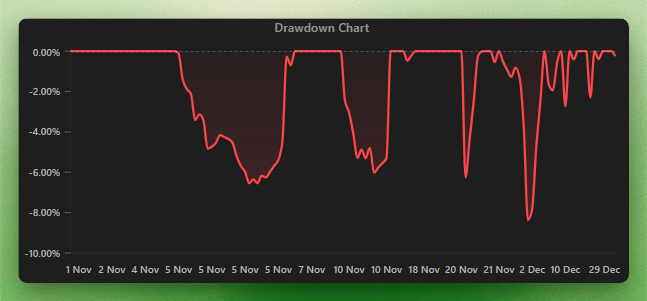
Drawdown is where emotional realism enters the conversation. If your strategy's historic drawdowns are too large for your psychology or account structure, that is not a minor detail. It is a design problem.
When account capital is available, drawdown percentage uses the account's capital basis rather than peak realised P&L. Without a valid basis, Journalit keeps the display amount-based instead of inventing a percentage.
Combined drawdown
Track the full peak-to-trough decline across the filtered trade set.
Directional P&L
Compare cumulative long-side and short-side P&L with separate Long P&L and Short P&L widgets.
Directional drawdown
Split drawdown by long and short performance when direction-specific risk matters.
Drawdown stats
Review time in drawdown, recovery behaviour, and related pressure metrics alongside the chart.
Directional P&L Charts
Long P&L and Short P&L widgets split the cumulative P&L curve by trade direction. They are useful when the combined equity curve hides that one side of your trading is carrying the results while the other side is leaking.
Long P&L
Shows the cumulative realised P&L curve for closed long trades in the filtered set.
Short P&L
Shows the cumulative realised P&L curve for closed short trades in the filtered set.
Hourly Performance Chart
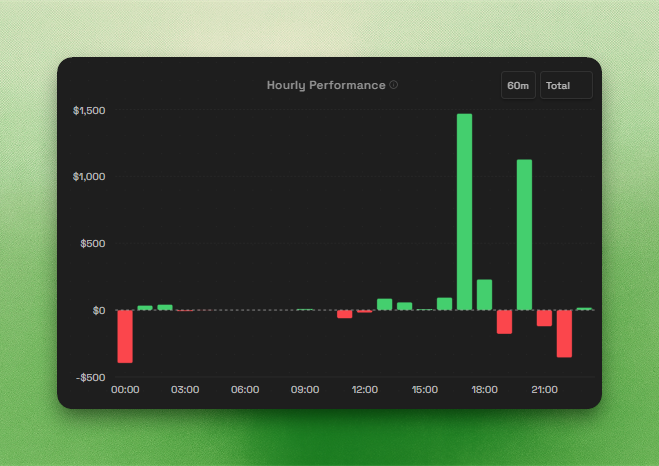
The Hourly Performance chart groups closed trades by time of day so you can see when your execution tends to produce or lose money.
Configurable bucket size
Choose 15-minute, 30-minute, or 60-minute buckets depending on how closely you want to inspect session timing.
Total or average view
Switch between total performance and average performance when comparing busier and quieter periods.
Shared date basis
The chart follows the global entry-date or exit-date analytics setting used across Journalit.
Tooltip context
Hover a bucket to inspect value, trade count, win rate, and win/loss breakdown.
Rolling Win/Loss Ratio
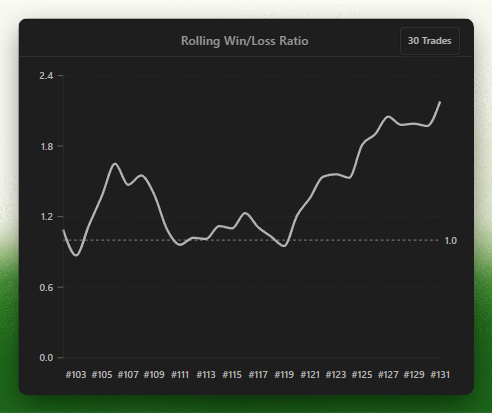
Shows whether your win/loss ratio is stable or moving in phases. Smooth behaviour usually signals consistent execution. Violent swings often point to unstable process or changing conditions.
Rolling Avg Win/Loss
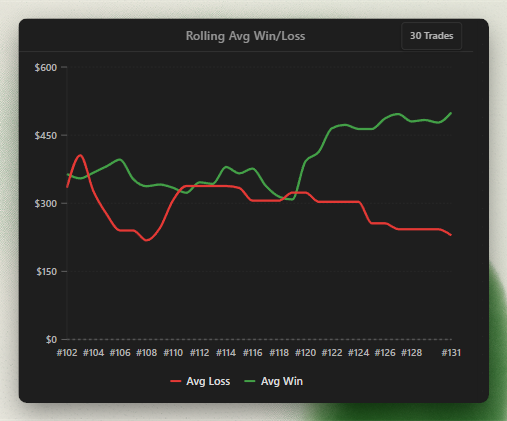
Tracks rolling average win and rolling average loss through time.
Configurable smoothing
Use 10, 20, 30, or 50 trades to change how reactive the lines feel.
Practical use
See whether your winners are expanding, shrinking, or getting closer to your losers.
Recent Trades Table
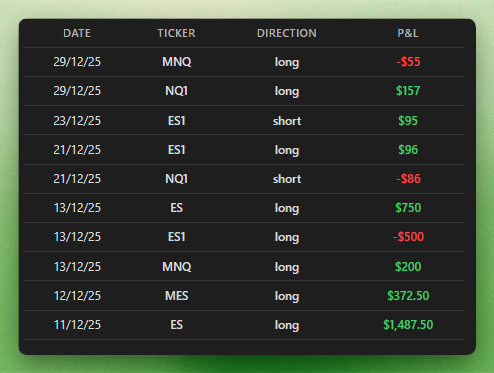
The recent trades table is a fast reality check on current execution without having to open notes one by one.
Customising Your Dashboard
Open Edit Layout in the top right to customise the workspace.
Reorder metrics
Drag the top metrics into the order that reflects what you actually care about first.
Add or remove metrics
Keep the strip focused on the statistics that influence your review process.
Resize and rearrange widgets
Treat it like a workspace: large for the views that matter, smaller for the ones you only reference occasionally.
Remove dead weight
If a widget is not helping you improve, it is just decoration.
Your layout saves automatically and persists across sessions.
The add-widget picker lists charts and visual widgets before metric cards, which makes the heavier analysis surfaces easier to find when you are building the bottom section of the dashboard.
Advanced Filtering
The filtering system is shared across Dashboard and Trade Log, which makes it much easier to move between analysis and drill-down work.
Filter Options
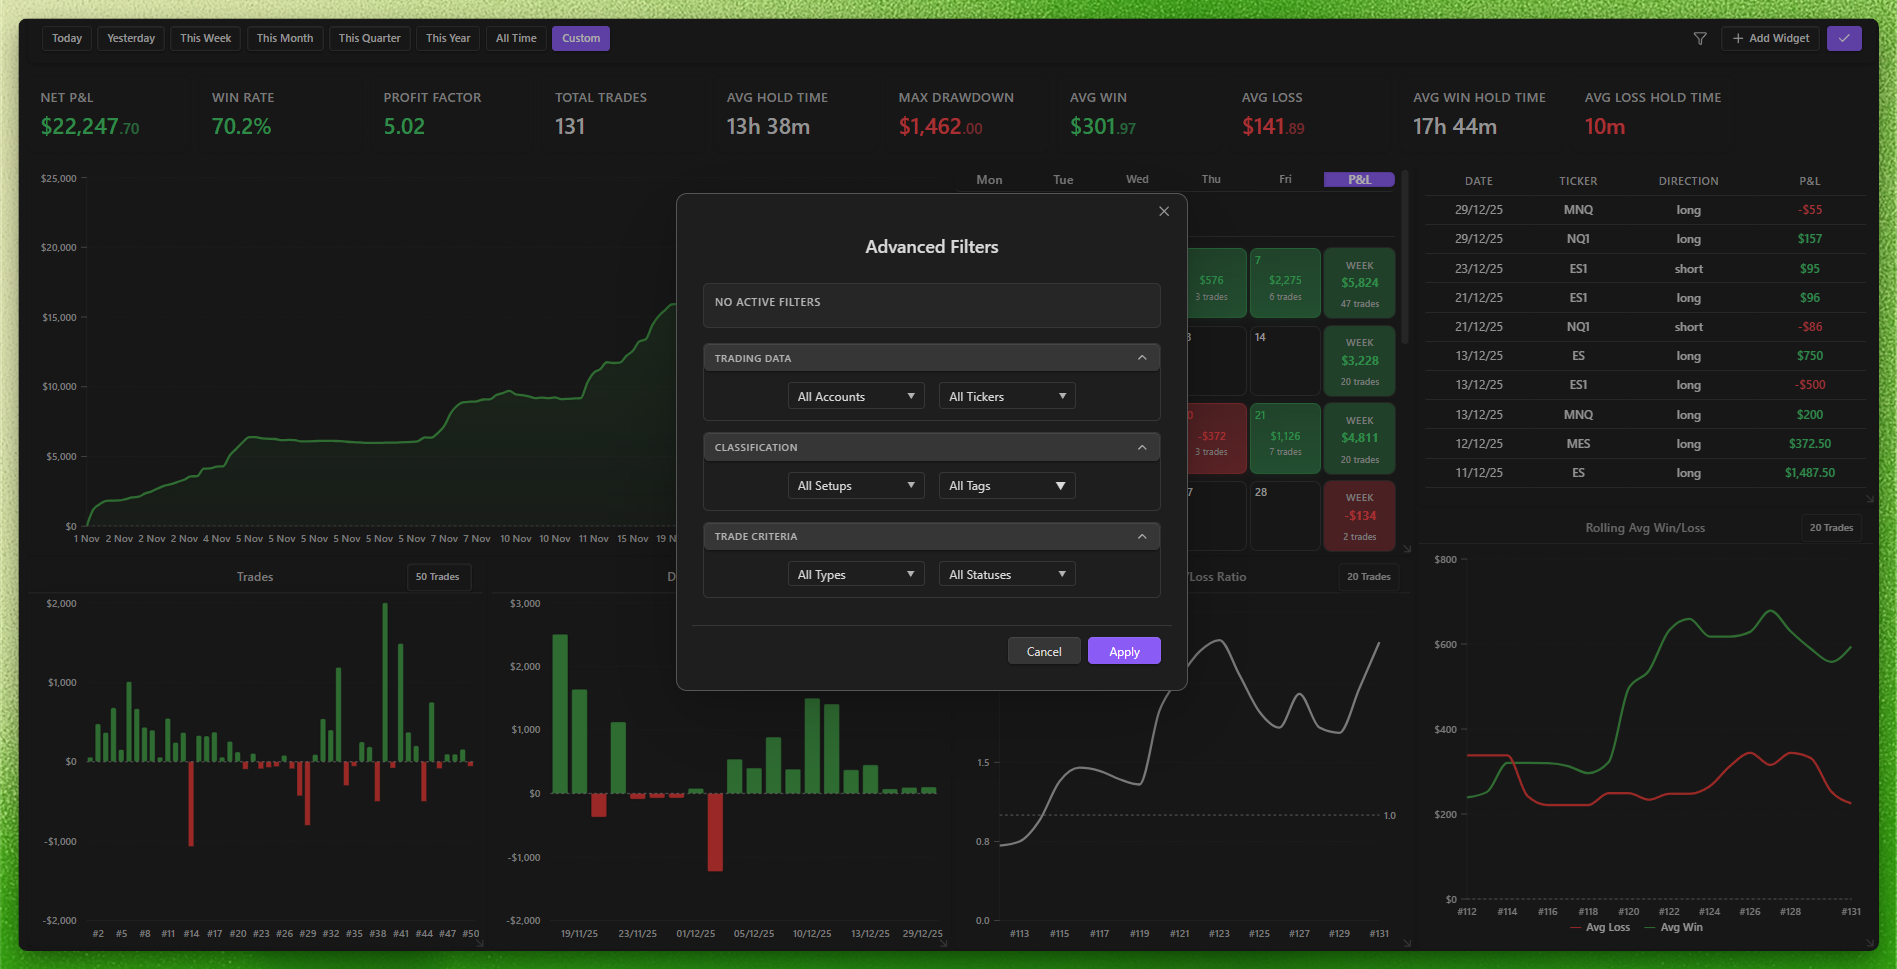
Accounts
Focus on specific trading accounts.
Tickers
Look only at specific instruments such as SPY or EURUSD.
Setups
Evaluate whether a particular setup or strategy actually works.
Tags
Use your custom labels to cut across multiple categories.
Trade Type
Separate regular, missed, and backtest trades.
Status
Filter for open, closed, win, loss, or breakeven trades using the same break-even rules configured in General settings.
Custom fields
Filter dashboard analytics by custom dropdown and multiselect field values when you want your own metadata to shape the analysis.
Copy accounts
All-account analytics exclude derived copy-account rows by default. Enable copy-account inclusion when you want copied performance included in the same analysis set.
Custom field filter scope
Dashboard custom field filtering supports dropdown and
multi-select fields.
Period Selectors
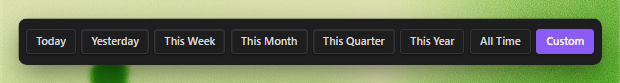
Quick ranges
Jump through Today, Yesterday, This Week, This Month, This Quarter, This Year, or All Time.
Custom range
Use manual date selection when the standard buckets are too broad.
Persistent filters
When you return later, the dashboard keeps the filters as you left them.
Analytics date basis
Dashboard analytics can group closed trades by entry date or exit date. Exit-date analytics uses dated realised P&L events, so open trades with partial exits can appear on calendars, bars, P&L charts, and account transaction views before the final close. Change this in Settings when you want charts and streaks to reflect when trades were opened versus when P&L was realised.
Getting Started
If you are new to the dashboard, start with the fundamentals rather than trying to interpret every widget on day one.
Check Net P&L
Are you making money or losing money? Everything else explains that answer.
Look at Profit Factor
If it is below 1.0, your process does not currently have positive edge.
Add the Cumulative P&L chart
Make sure the equity curve is heading in the right direction.
Include the Performance Calendar
This helps you spot timing and behavioural patterns early.
Compare hold times
This quickly exposes whether you are cutting winners or sitting with losers.
Best review cadence
The dashboard works best when you check it regularly but do not obsess over every daily fluctuation. Weekly review is usually the right frequency.
Bottom line
The goal is not to create the prettiest dashboard or track every metric you can find. The goal is to understand your trading well enough to make better, calmer, more consistent decisions.