Futures and forex trading contains substantial risk and is not for every investor. An investor could potentially lose all or more than the initial investment. Risk capital is money that can be lost without jeopardizing one’s financial security or lifestyle. Only risk capital should be used for trading and only those with sufficient risk capital should consider trading. Past performance is not necessarily indicative of future results.
Hypothetical Performance Disclosure
Hypothetical performance results have many inherent limitations, some of which are described below. No representation is being made that any account will or is likely to achieve profits or losses similar to those shown; in fact, there are frequently sharp differences between hypothetical performance results and the actual results subsequently achieved by any particular trading program. One of the limitations of hypothetical performance results is that they are generally prepared with the benefit of hindsight. In addition, hypothetical trading does not involve financial risk, and no hypothetical trading record can completely account for the impact of financial risk of actual trading. for example, the ability to withstand losses or to adhere to a particular trading program despite trading losses are material points that can also adversely affect actual trading results. There are numerous other factors related to the markets in general or to the implementation of any specific trading program that cannot be fully accounted for in the preparation of hypothetical performance results and all which can adversely affect trading results.
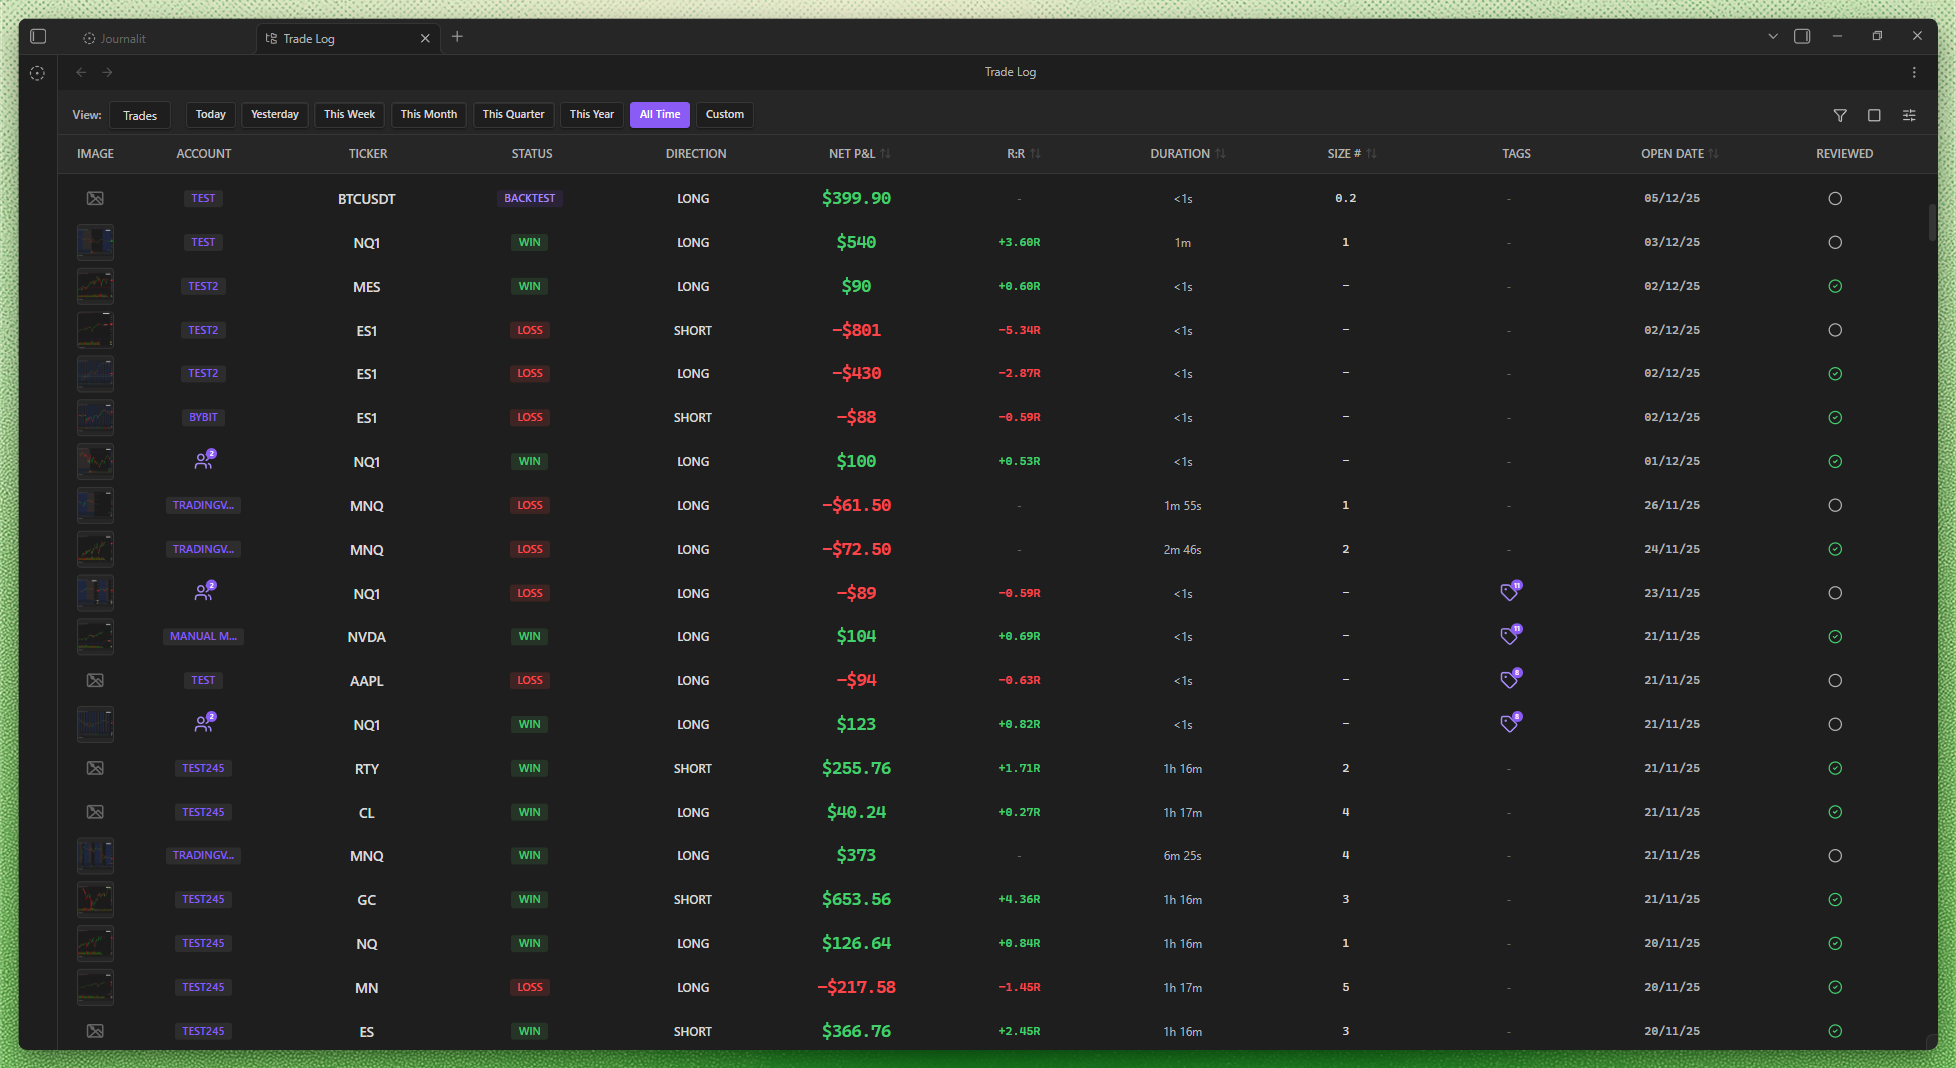
The Trade Log is Journalit's trade database. It gives you one place to search,
filter, organise, and review every trade you have taken without bouncing
between notes, folders, or spreadsheets.
What the Trade Log is really for
This is not just a table. It is the operational layer for managing a large
trade history efficiently and turning raw trade records into usable analysis.
Trade Log Overview
Open it from the command palette with Ctrl+P and run Open Trade Log, or jump
in from Home View.
Central trade database
See your entire trade history in one place instead of hunting through notes or folders.
Fast management layer
Sort, filter, and batch-edit trades without needing external tools.
Analysis surface
Move from raw trade records into patterns, review notes, and account-level context.
Trade Log modes
Switch between the table and Gallery modes depending on whether you need to work
with trade data or review attached media.
Trades
Use the table for detailed inspection, sorting, filtering, grouped time views, and batch operations on specific trades.
Gallery
Use the gallery to scan trade and review-note media, open items fullscreen, and add media-specific tags or notes.
Rule of thumb
Use Trades when you are managing records. Use Gallery when you are reviewing
charts, video, GIFs, and other trade evidence across the journal.
Gallery
Gallery collects media attached to trade notes and review notes, plus supported
files from vault folders configured in Settings.
It includes images, GIFs, local video, supported YouTube links, and Excalidraw
files. It is a Trade Log mode, so your existing trade filters continue to work
while media-specific filters are added where they help.
Trade and review sources
Browse all media, trade attachments, or review-note media. Review sources can be narrowed to daily, weekly, monthly, quarterly, or yearly reviews, with reviewed state shown where it exists.
Gallery folders
Browse supported media from selected vault folders, grouped by folder or shown as individual cards.
Grouped or individual cards
Group media from one trade or review note into a single card, or switch to individual cards for a media-first contact sheet.
Flexible scanning
Sort by newest, oldest, best P&L, or worst P&L, then choose small, medium, or large preview cards.
Fullscreen review
Open a gallery card fullscreen, move through the visible media, and return to the source note when you need the full context.
Privacy-aware display
Privacy Mode blurs gallery media and suppresses performance context that could reveal outcomes.
Choose a Gallery view
Use Grouped to review all media attached to one trade or review
note together. A group card shows the source entry and the number of attached
media items, while tags and notes remain attached to their individual media.
Use Individual when you want every image, video, GIF, or
YouTube link to appear as its own card. The preference is saved, so Gallery
opens in the view that suits your review style.
When you open a grouped card fullscreen, navigation moves through that entry's
media before continuing to the next visible entry.
Configured gallery folders appear under the Folders source.
Journalit scans them recursively and opens the media file itself when you choose
Open source. Folder-media annotations are stored in
!Journalit/Gallery Media Annotations.md so they remain part of the
vault.
Filter chart evidence
The Advanced Filters entry point is shared with the table. In Gallery mode, it
also includes media-specific filters for annotation status and media
tags. Combine them with normal filters such as account, setup, date range,
direction, trade type, review state, and supported custom fields. Review state
works for review-note images as well as trade images.
For example, filter to one setup, then show only media tagged
liquidity sweep or media with notes. The gallery keeps the media
annotation separate from the trade's own tags, so a chart can carry its own
lesson without changing the classification of the whole trade.
Tag and annotate media
Open a media item fullscreen and choose Tag. Add tags and notes
to that individual item, then save. Journalit stores the annotation in the source
note's frontmatter and keeps the gallery index up to date.
The same annotation travels with the media across Journalit. You can edit it
from a Trade Form attachment, rendered trade or Trade Log media, review image
widgets, Setup screenshots, and supported fullscreen viewers. Annotation mode
stays open while you move through a carousel, which makes it practical to label
several charts in one pass.
What belongs in a media annotation
Use annotations for the chart-specific idea you want to remember, such as a
failed breakout, a liquidity sweep, or the market structure at entry. Keep
trade-level setup, account, and outcome data on the trade itself.
Hierarchical Navigation
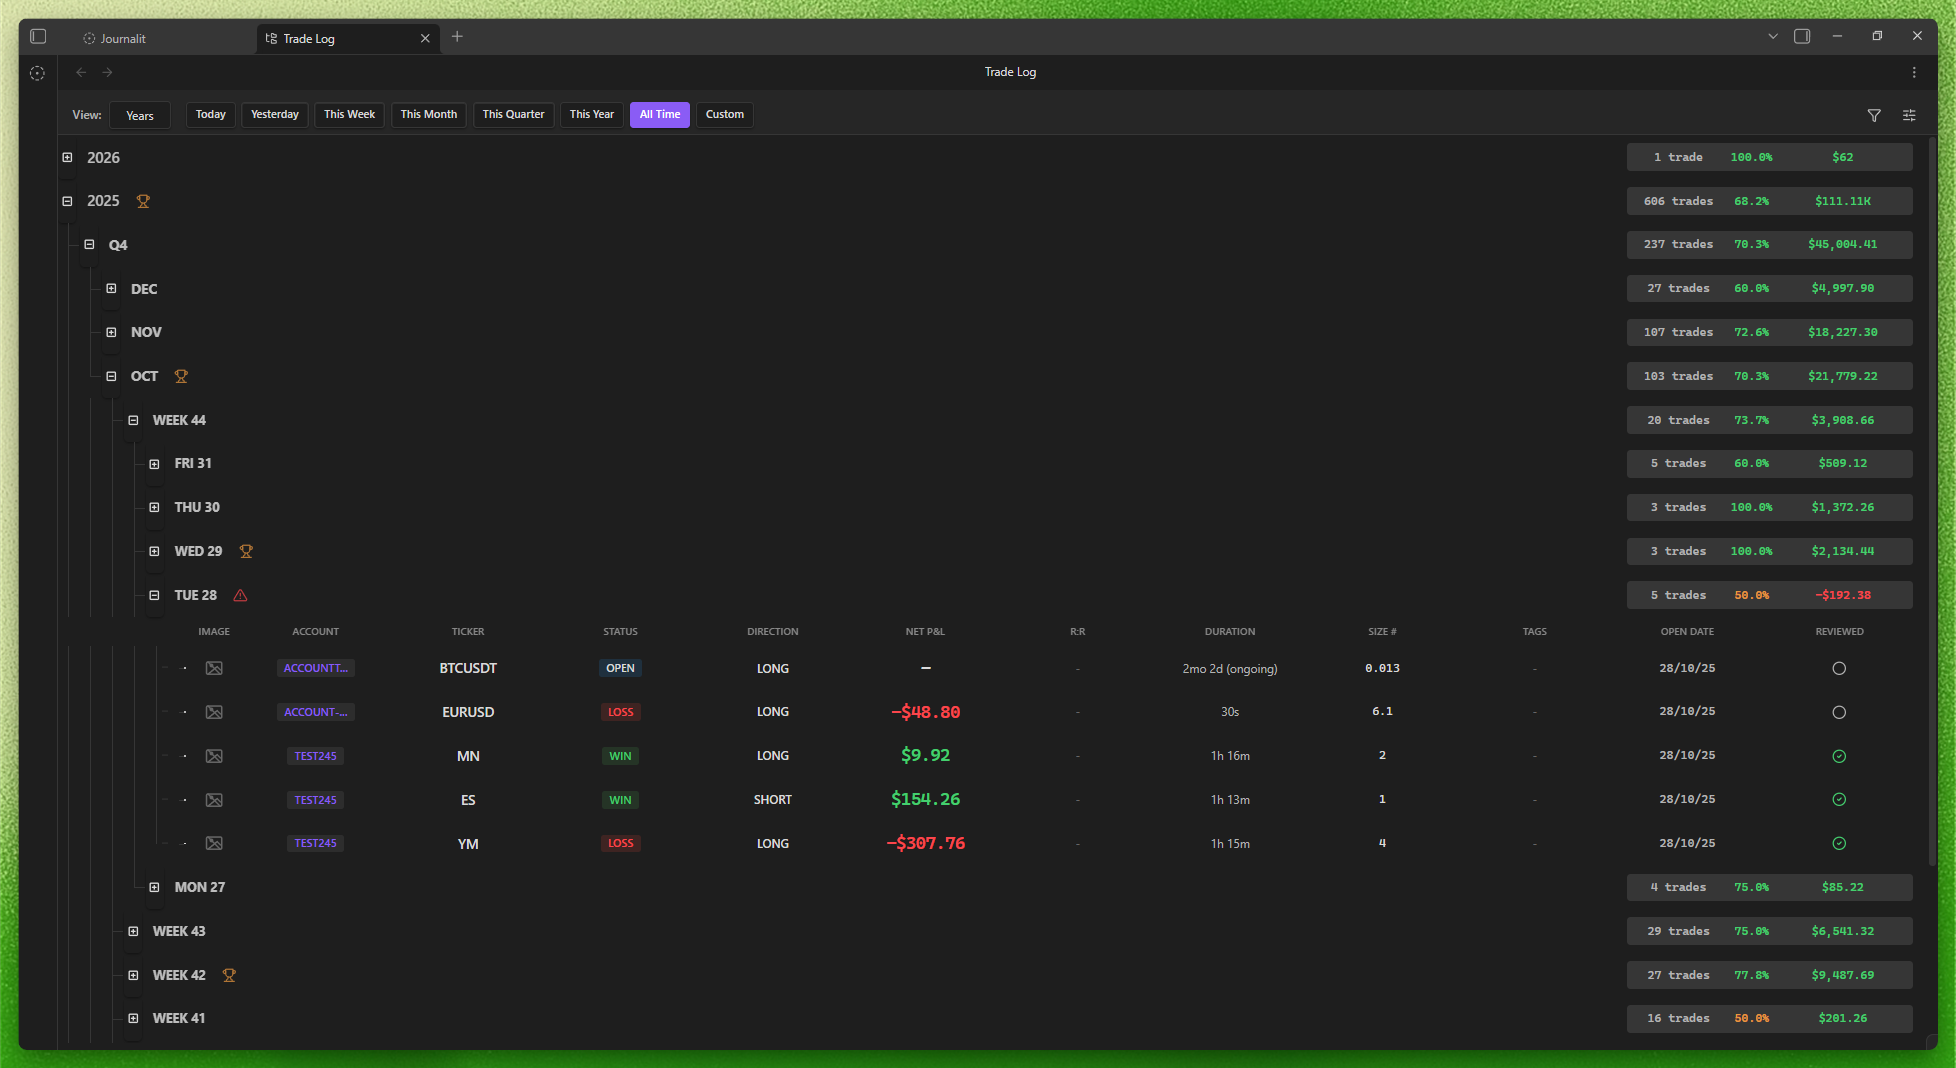
The tree hierarchy is one of the strongest parts of the Trade Log because it
matches how trading review actually works.
Years
See the large-scale structure of your trading history.
Quarters
Break the year into more meaningful review periods.
Months
Scan monthly performance and drill down when something stands out.
Weeks
Review behaviour and consistency in a practical working rhythm.
Days
Move from summary to the exact session and individual trades behind it.
Clicking a period label opens the corresponding review note for that period.
That means the Trade Log is also a navigation layer for DRCs, weekly reviews,
monthly reviews, and beyond.
Multi-Select And Batch Operations
Managing multiple trades at once is where the Trade Log stops being a passive
record and becomes a real workflow tool.
Selecting Trades
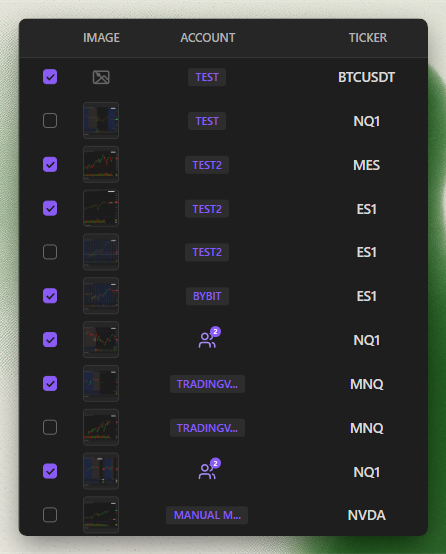
Single selection
Click a trade to select it directly.
Range selection
Use Shift+Click to select everything between two trades quickly.
Checkbox control
Toggle individual trades on or off in multi-select mode.
Select all visible
Capture the whole filtered result set in one action.
Batch Operations Toolbar
When trades are selected, the toolbar exposes the actions you can apply across
all of them.
Bulk delete
Remove multiple trades in one action when cleaning up unwanted records or test data.
Mark reviewed
Clear a backlog of already-analysed trades without opening each one individually.
Add setups
Apply strategy labels across a group of related trades quickly.
Add tags
Apply custom tags to selected trades when a session, import, or theme needs the same label.
Add mistakes
Tag recurring execution errors across multiple trades at once.
Important limitation
Multi-select mode must be enabled before selection and batch operations become
available.
Practical use case
Shift+Click is especially useful when you want to clean up a bad import,
remove test trades, or tag a cluster of trades from the same session.
Column Customisation
The Trade Log is meant to adapt to how you analyse trades, not force everyone
into the same table.
What You Can Show
A broad set of columns is available, covering both core trade data and deeper
analysis context.
Entry date, entry time, exit time, and close date for time-sensitive review.
Price columns
Entry price, exit price, stop loss levels, and price move for quick distance-based review.
Risk columns
R-multiple, Max R, Return %, stop-loss distance, risk amount, and risk-reward ratio.
Cashflow columns
Position size, dividends, fees, and exchange context.
Excursion columns
MAE and MFE follow the global display unit, using currency or ticks for eligible futures trades.
Categorisation columns
Setups, mistakes, and tags so you can analyse behaviour, not just numbers.
Broker metadata
MetaTrader users can show the synced MT Comment column when broker-side comments matter for reconciliation or review.
Custom field columns
Add your own custom trade fields as Trade Log columns so structured metadata is visible without opening each note.
Open trades with a market-price snapshot show combined realised and unrealised
P&L in the P&L column. A ~ marker identifies the floating
value, and the tooltip separates the realised and unrealised amounts.
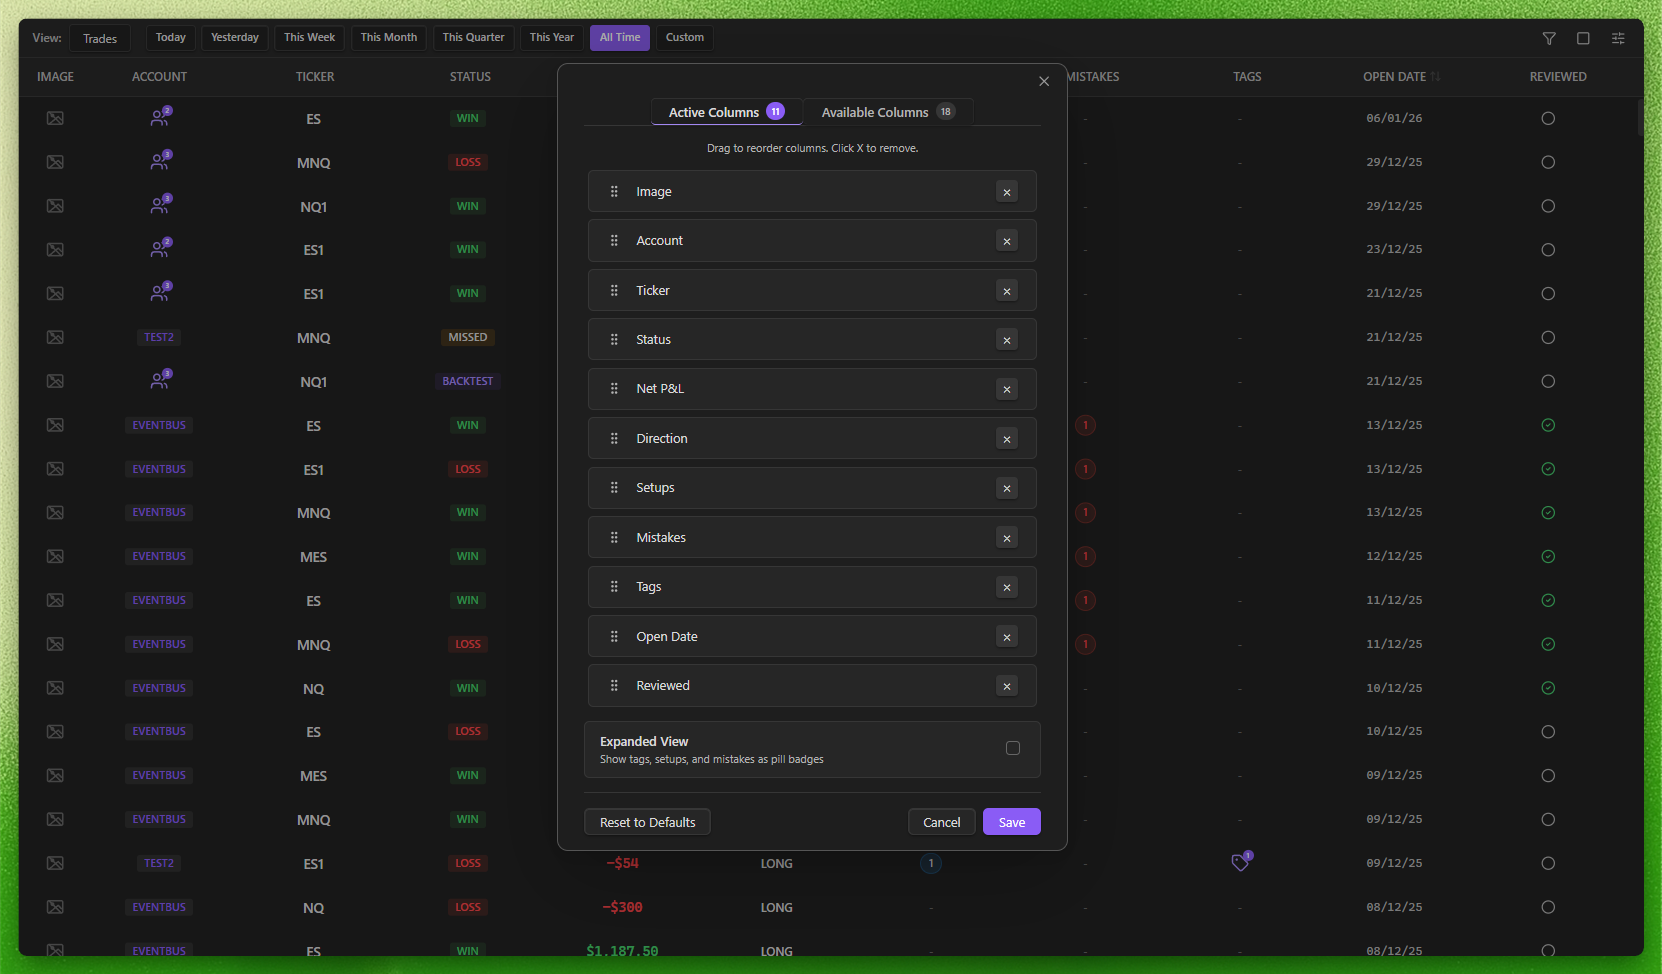
Expanded mode
Tags, setups, and mistakes can be shown as coloured pill badges instead of
truncated text when you enable expanded mode.
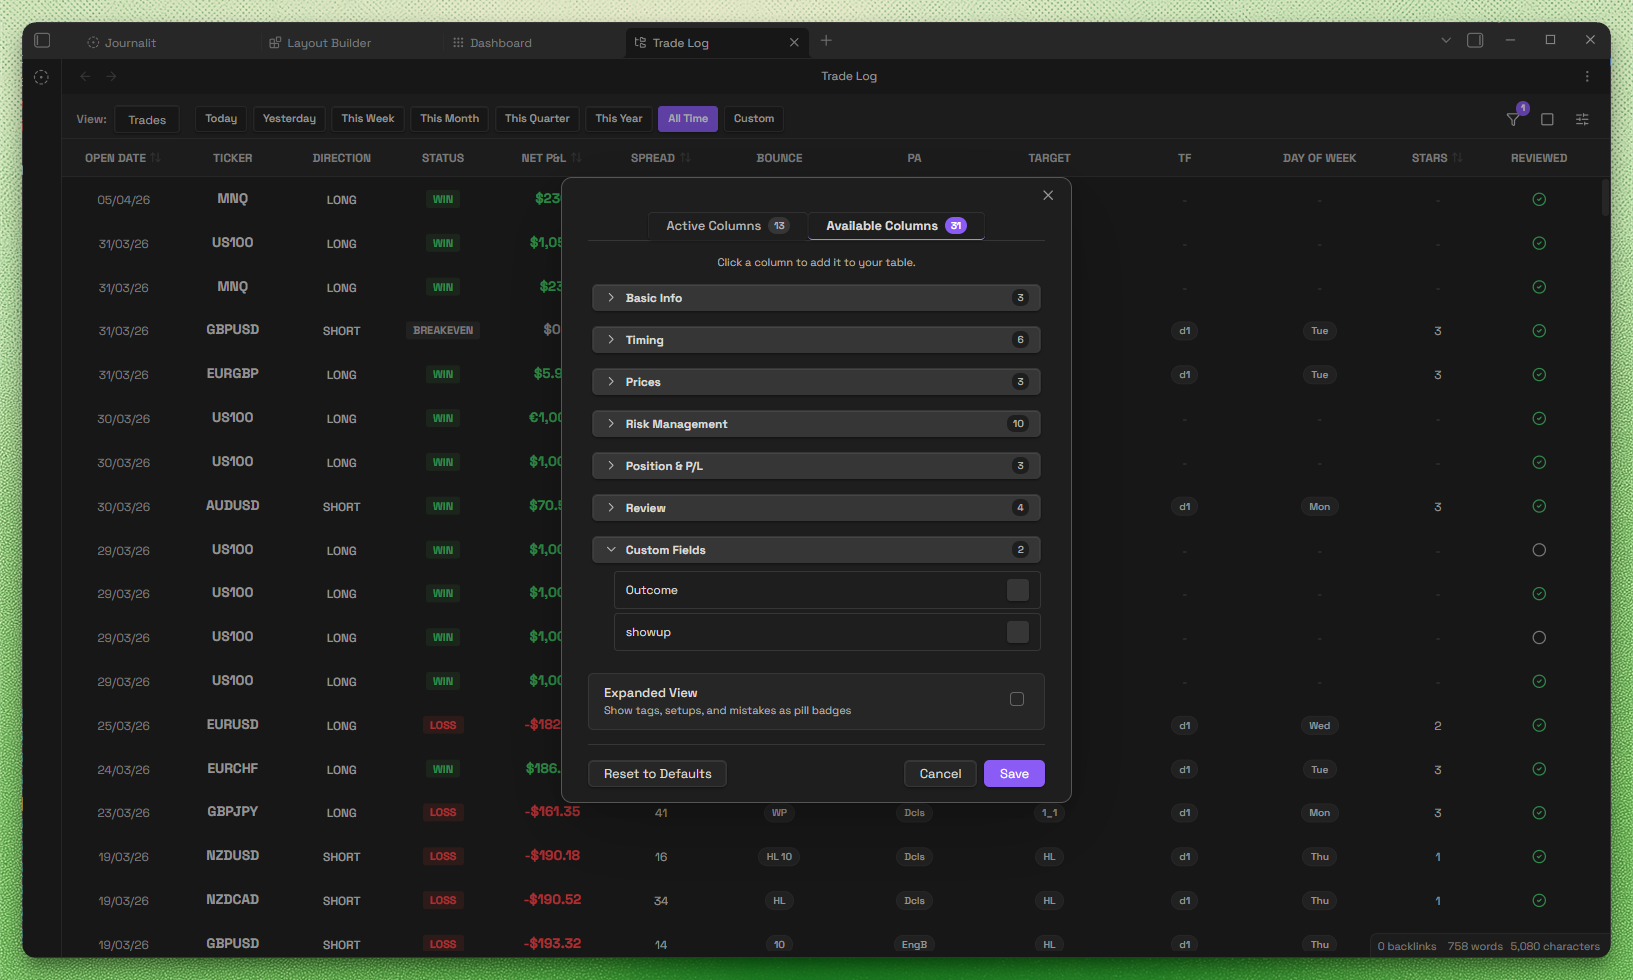
Configuring Columns
Open column settings
Click the column settings icon in the Trade Log toolbar.
Choose what matters
Add the columns you actually use and remove the ones that create noise. Custom
field columns appear at the bottom of the Available Columns
list. Number custom fields can be displayed as currency in the Trade Log when
the field represents a monetary value. MetaTrader users can also enable
MT Comment alongside risk-focused columns such as Max R,
Return %, and Price Move. If you track per-trade cashflow events, the
Dividends column can sit beside fees and realised P&L.
Reorder the layout
Drag active columns into the order that matches how you scan trades.
Use sorting when needed
Click any column header to sort by that field, then click again to reverse the
order. Direction and reviewed status columns can be sorted like the rest of the
table.
Your column configuration persists, so you do not need to rebuild the view every
time you open the Trade Log.
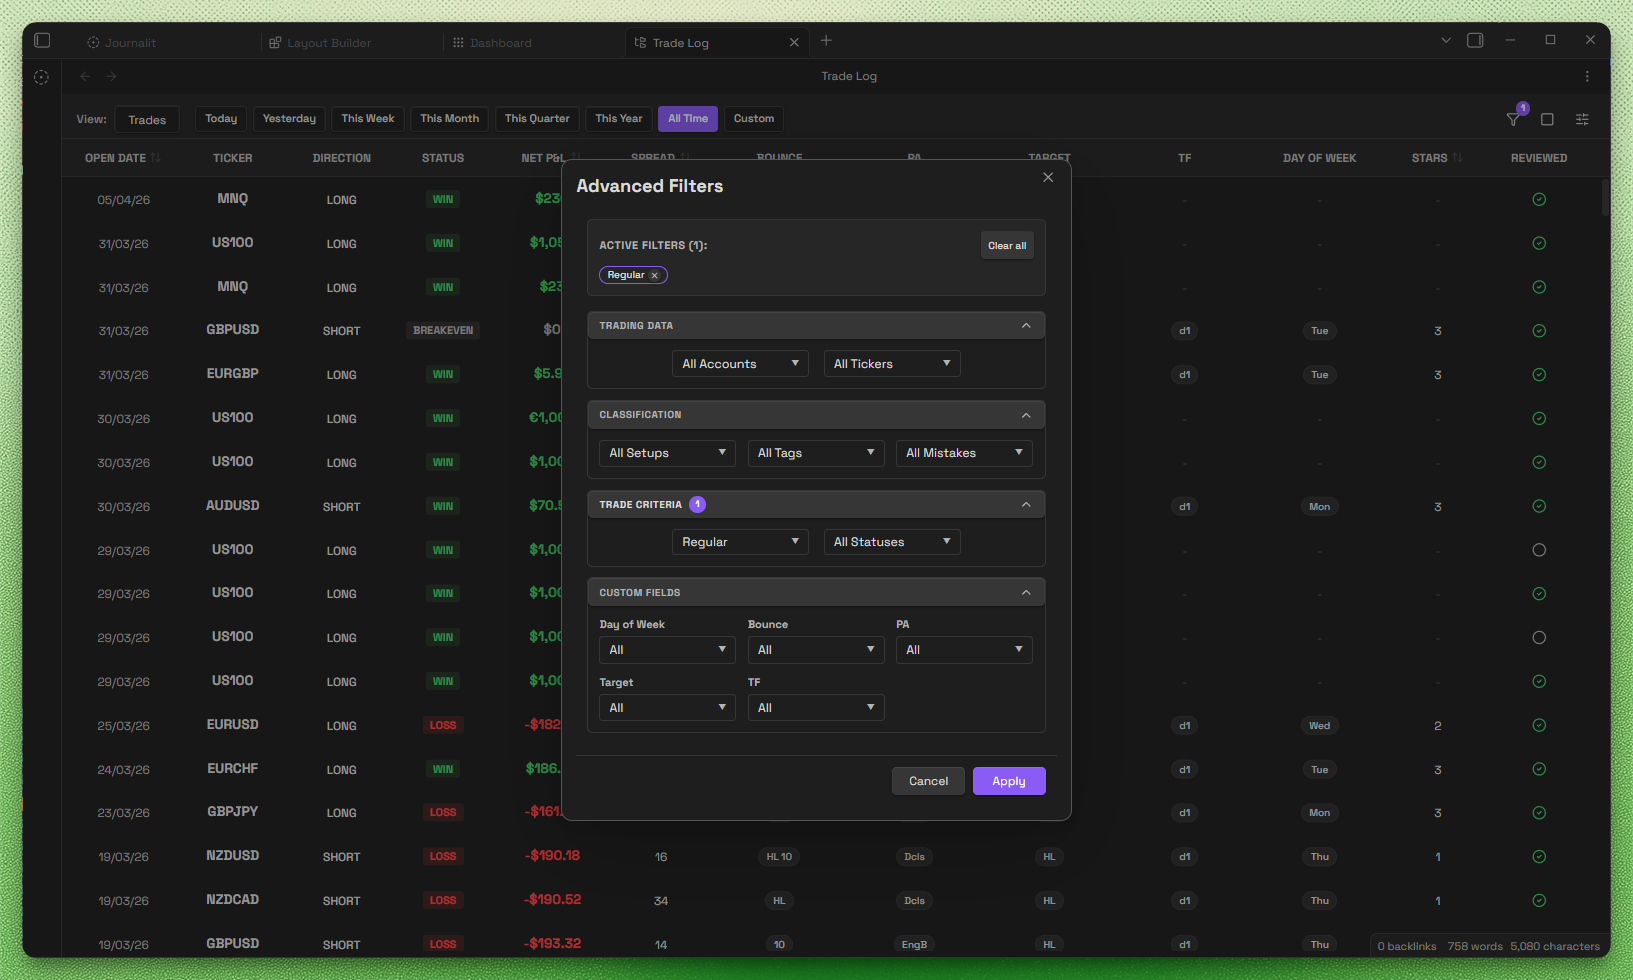
Advanced Filtering
Filtering is what turns a large trade history into something usable.
Date range
Filter by This Week, This Month, This Quarter, This Year, or a custom period.
Status
Focus on open, closed, win, loss, or breakeven trades using the same break-even rules configured in Trades settings.
Review status
Focus on reviewed or unreviewed trades when post-trade analysis is the job at hand.
Direction
Filter long or call trades separately from short or put trades.
Trade type
Separate regular trades from missed trades or backtests.
Account
Filter to one account or compare a specific subset of accounts.
Ticker
Analyse a single instrument without the rest of the book getting in the way.
Setup and tags
Break the log down by strategy labels and your own custom categorisation.
Custom fields
Filter by custom dropdown and multiselect field values when your own metadata is part of the analysis.
Custom field filter scope
Custom field filtering supports dropdown and
multi-select field types.
The filter menu is the same one used on the Dashboard.
Any value can be excluded with the exclusion button beside it, and setups, tags,
mistakes, and multi-select custom fields support the match modes Any of, All of,
Only these, and Exactly these. Accounts with two or more prop phases expose a
phases submenu.
Why persistence matters
Filters persist across sessions, so when you come back to the Trade Log your
analysis context is still there instead of resetting every time.
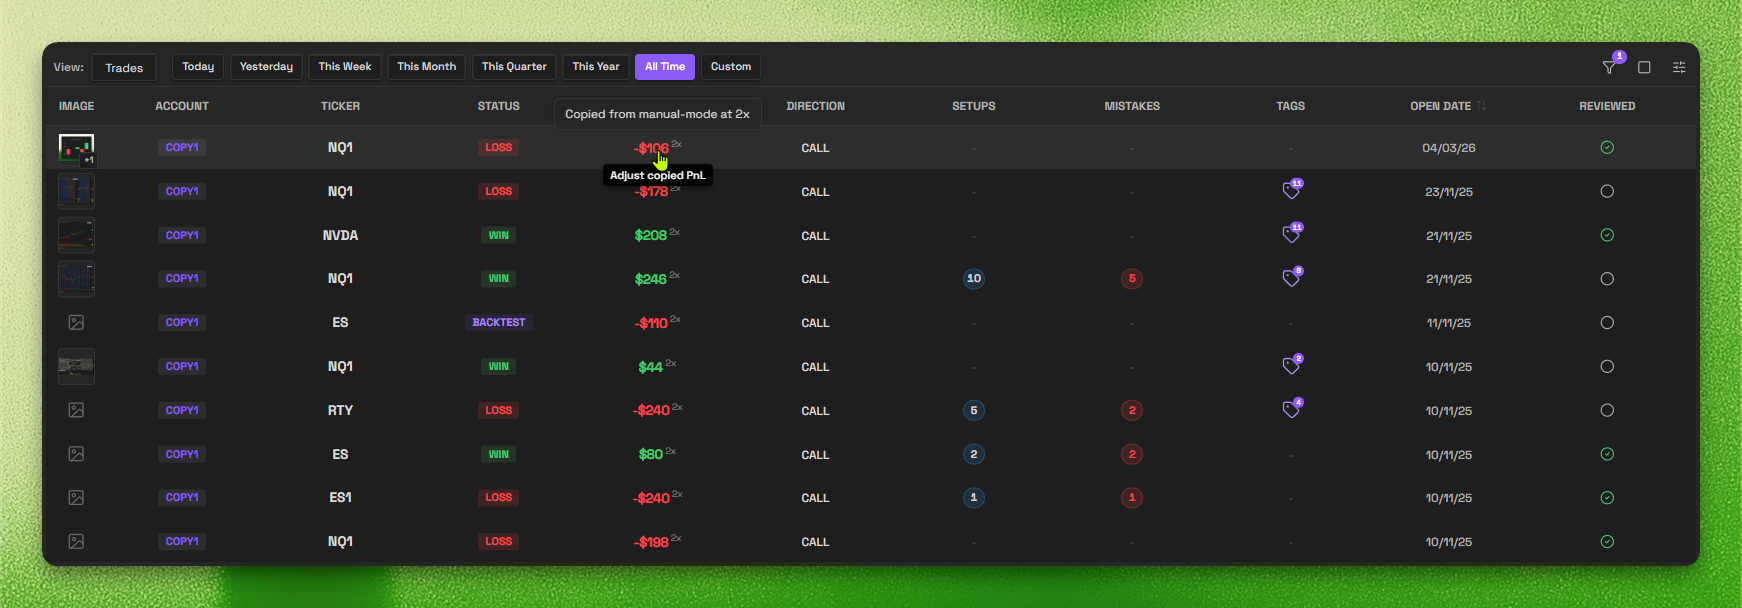
Copied Account P&L Adjustments
Copy trading accounts can show derived trade rows in the Trade Log. Those rows
use the copy account's multiplier and copied-trade cost settings, but you can
still make a manual P&L adjustment when a copied fill needs account-specific
correction.
Open the copied account's Trade Log
Open the copied account page and use the top-right Trade Log shortcut. Journalit
opens the Trade Log with that account already filtered.
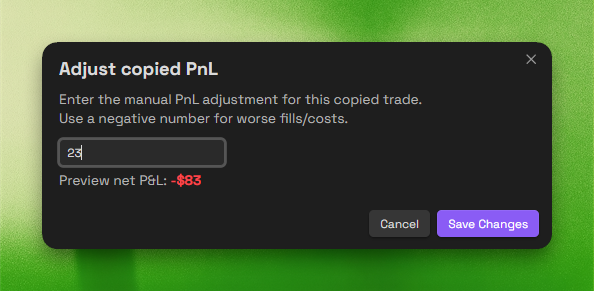
Click the copied trade P&L
Hover a copied trade's P&L value and click it to open the copied P&L
adjustment modal.
Enter the account-specific adjustment
Enter the manual adjustment for that copied account. Use a negative number for
worse fills, slippage, fees, or other costs.
Performance Indicators
Tree views are not just folders with counts. They surface useful performance
signals at the period level.
Best-period indicators
Trophy icons highlight your strongest periods so you can study what worked.
Weak-period indicators
Warning markers help you spot periods that deserve deeper review.
Colour-coded P&L
Profits and losses are easier to scan visually when period rows carry immediate colour context.
Aggregated stats
Trade count, win rate, and P&L appear directly on each time-period row.
Navigation Features
The Trade Log is tightly connected to the rest of Journalit's workflow.
Open trade notes
Click any trade to jump into its detailed Trade Notes page.
Open review notes
Click a time period label to open the related DRC, weekly, monthly, quarterly, or yearly review.
Keep your place
Scroll position is remembered when you navigate away and return.
View N trades after an import or synchronisation opens the Trade
Log scoped to the notes written by that operation. The scoped view uses a
banner, limits the list to those trades, and restores the usual mode and
filters on exit.
How It Connects To The Rest Of Journalit
The Trade Log is not an isolated feature. It sits in the middle of the broader
system.
Trade Sync
Synced MetaTrader 4 or imported broker trades flow directly into the log.
Manual Entry
Manually created trades sit beside synced trades in the same database.
Review System
Use the log to move from trade data into structured review notes and back again.
Account Management
Filter by account when you need account-specific analysis across a portfolio.
Dashboard
The Trade Log shares the broader filtering and analysis mindset used throughout Journalit.
Bottom line
The Trade Log makes large trade histories manageable. Multi-select,
shift-selection, batch actions, column control, and strong filtering turn the
trade database from a passive archive into a practical analysis tool.